

I’m delighted to be taking part once again in Azure Spring Clean, a community event focused on Azure management best practices. Many thanks to Joe Carlyle and Thomas Thornton for organising this event and allowing me to contribute. Please check out the website from the link above for loads more excellent Azure articles.
This year my focus is going to be on monitoring and specifically monitoring connections to and from your virtual machines through Network Watcher.
What is Network Watcher?
Network Watcher is a set of monitoring and diagnostics tools in the Azure portal used for monitoring and troubleshooting IaaS products connected to Azure virtual networks. These tools are invaluable to anyone who works with virtual networks and what surprises me is the number of people who simply don’t know about Network Watcher. It is somewhat hidden away from plain sight so you aren’t likely to accidentally stumble across it and really need to go looking for it. Just type ‘network watcher’ into the search bar in the Azure portal to access the service. The full documentation for Network Watcher can be found here, and I would recommend to be familiar with each of the tools available as I can almost guarantee if you are working with IaaS services that that you will use them all at some point. For this blog, I will just be focussing on connection monitor and how this can be used to monitor connections for your virtual machines.
About connection monitor
Firstly, be aware that there is a ‘classic’ connection monitor tool. This is the old version and has now been replaced. This classic version will be retired in 2024 and it will not even allow further monitors to be added after 1st July 2021 so please ignore it.
Connection monitor is a tool for you guessed it, monitoring connections. Specifically between virtual machines or between a virtual machine and an endpoint like an IP address, FQDN or URL. Your virtual machines don’t have to be on Azure either, as long as the log analytics agent can be installed you can monitor the virtual machine so this is very much a hybrid tool. Connection monitor is particularly useful for monitoring availability of either your virtual machines or an external endpoint. Connection monitor also measures the round trip time of your connections so it can be a useful tool to keep a live monitor of network latency as well.
Below are some common real world use cases that I have found for using connection monitor:
- Monitor the outbound virtual machine Internet connection to a public IP address
- Monitor the outbound virtual machine Internet connection to a public FQDN or URL – similar to the above but includes DNS resolution which is always an important service to test!
- Monitor connectivity between virtual machines on the same virtual network
- Monitor connectivity between virtual machines on peered virtual networks
- Monitor connectivity between virtual machines (or to an IP addresses/FQDN) across a VPN or ExpressRoute connection
- Monitor the connection latency for all of the above
Let’s set up the basics
You should find that network watcher has already been registered for any regions where you have virtual networks deployed. If not, your first step will be to register network watcher for the region(s) required.
Once registered you can click on Connection Monitor and then click Create.
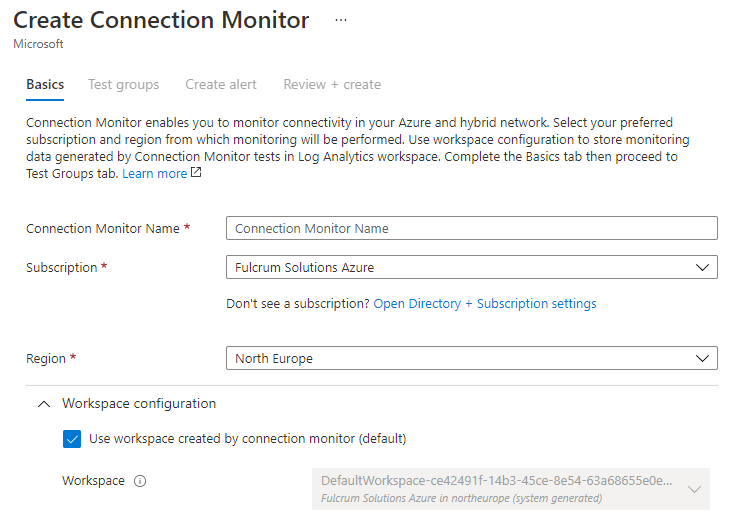
Your first step will be to either create or select an existing log analytics workspace for your region of choice. This is where the monitoring logs will be stored for your monitors. You get a free monthly allowance for 5GB of log analytics data for a 31 day retention period with Azure so please understand that if you exceed the 5GB you will incur additional costs here.
Now for some test groups
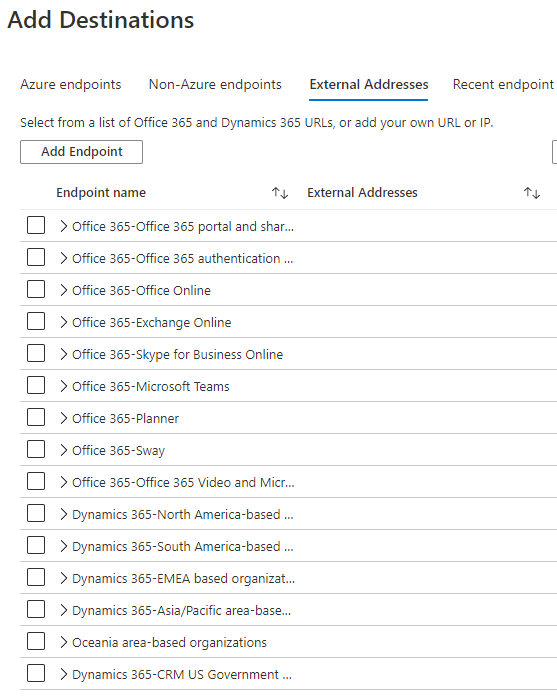
The next step is where you can add your test groups. These are simply groups of endpoints that you want to monitor and test for connectivity.
You will see the source and destination settings have similar options. You can choose an Azure or non-Azure endpoint (virtual machine) but in addition for the destination endpoints you can select an external address.
Let’s select some Azure endpoints as our source endpoints by searching through the VNET and subnet filters, but there’s a problem…

A network watcher VM extension must first be installed on any Azure virtual machines that you want to monitor. This extension is used by some of the other network watcher tools also so it’s worth installing this extension any time you deploy an Azure virtual machine to save some time if you ever need to troubleshoot network issues.
Simply go to the virtual machine you want to monitor and click on extensions under the settings section and then add the Network Watcher agent for Windows or Linux depending on the OS of the virtual machine.
Once the network watcher agent is installed you can select your endpoints for monitoring.

With our source endpoints selected, let’s now select some destinations endpoints. These can be other Azure virtual machines, non-azure virtual machines (with the log analytics agent installed) accessible via VPN or ExpressRoute or an external custom IP address, FQDN or URL. You can also choose from a pre-populated list of various Office 365 services. External endpoints can be a useful way of to ensure Internet access and DNS services are functioning correctly as well as monitoring availability of externally hosted services.
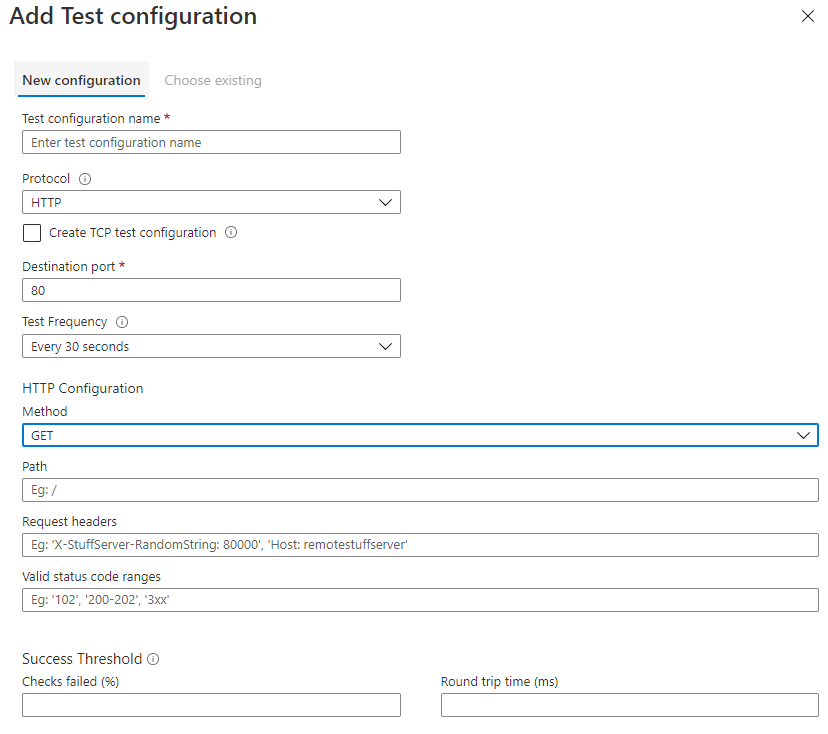
With our source and destination endpoints added, we need to add a test configuration. This is where you can specify how you want to test the availability of a particular endpoint. You can use the HTTP, TCP or ICMP protocols and depending on the protocol you want to use you will have different options available to you including the test frequency and success threshold. This might be something as simple as an ICMP ‘ping’ test to ensure an endpoint is responding or you might what to get more specific and test a REST API response.
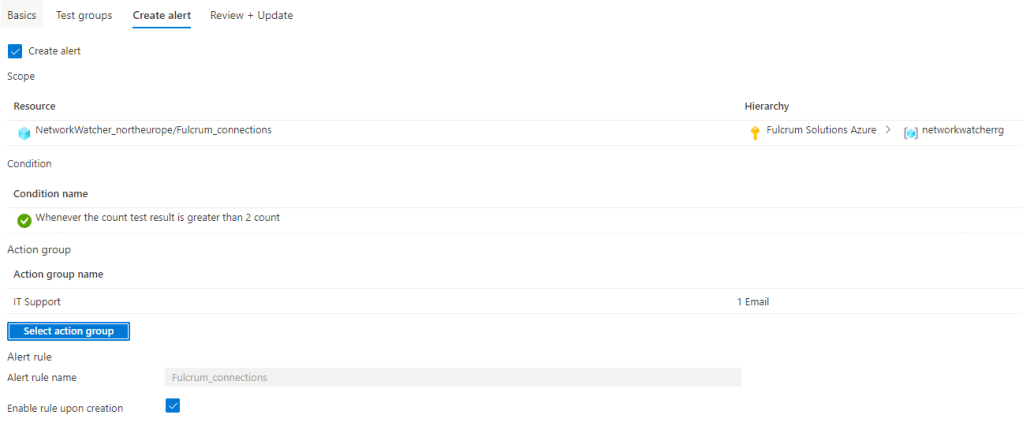
Once your test source, destination and configurations have been added you will want to create an alert so that you are notified if any of your tests are failing.
The next step of the process will allow you to do just this and you can later modify this alert rule directly from within Azure Monitor.
Lastly, you can do a final review before you create your connection monitor and in a few moments you will be live monitoring your virtual machines.
Monitoring and alerting
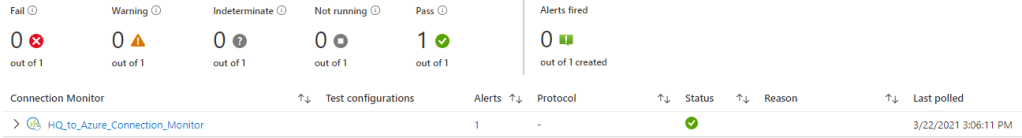
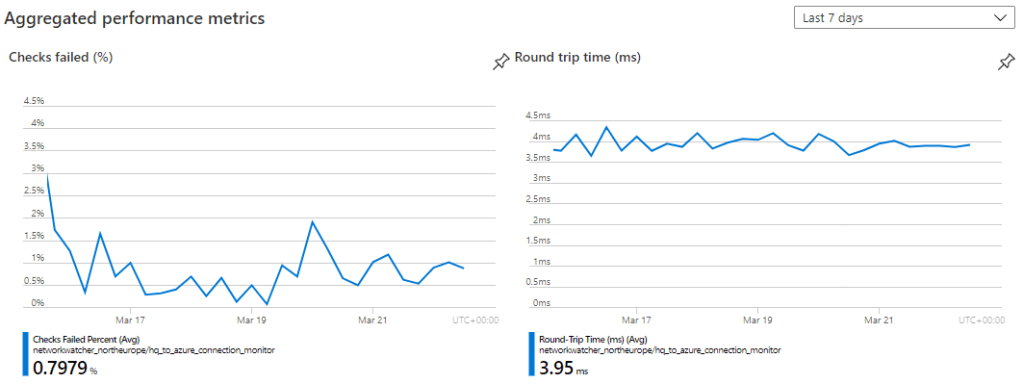
You can track your monitors directly from the connection monitor within network watcher. This provides a great overview of all the key metrics that you need to keep an eye on.
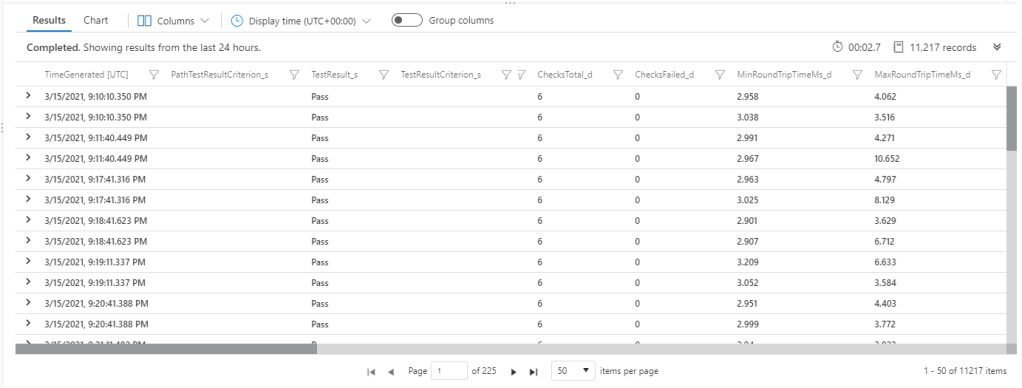
In addition, you also have access to the full log output in log analytics where you can perform your own custom queries and drill down into your results for more detailed analysis.
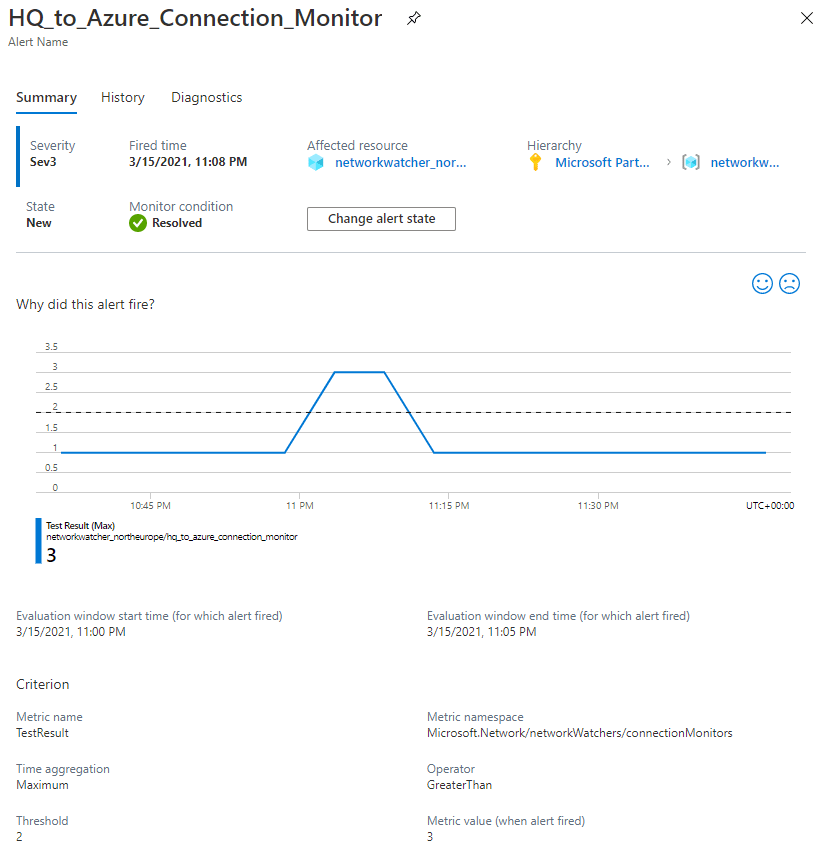
If you have configured your alerts during the setup process then once your specified alert threshold is exceeded your alert action group should receive the alert via the chosen delivery method, e.g. email, SMS, push notification etc. You can manage the alerts directly in Azure Monitor.
If required, you can get quite granular with the type of connectivity tests and alerts required, so don’t mistake connection monitor as a simple “down detector” type test. For Azure virtual machines especially this tool can be very helpful at identifying issues such as:
- VMs not in a running state
- Network routing issues
- DNS resolution issues
- Virtual network gateway issues
- Traffic blocked by NSG or firewall rules
Conclusion
Connection monitor is quite a simple service to implement but one I feel that is invaluable where you need to be proactive about troubleshooting connectivity issues. After all, it’s better to know about an issue before your customer starts complaining. Automation should always be used for alerting before the fact rather than adopting a break/fix approach and then trying to firefight issues after they’ve happened. The tools are there to be used so get monitoring those virtual machines.
