
I’ve been spending a lot more time recently working with Azure Monitor and Log Analytics.
With Log Analytics you can not only monitor your Virtual Machine performance counter metrics but your Windows event logs as well. Something that I discovered is that although you can query the system and application Windows event logs you cannot query the security log with just Log Analytics. To do this you will need to enable the Standard tier Security Center and enable data collection from your Virtual Machines to your Log Analytics workspace.
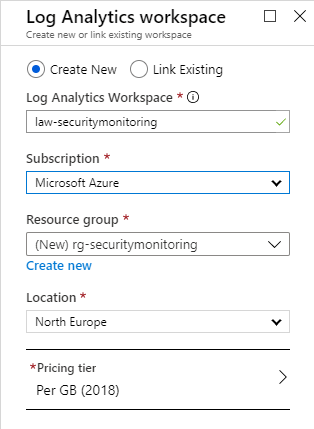
Let’s start off by creating a new Log Analytics workspace. Feel free to use an existing one here if you want.
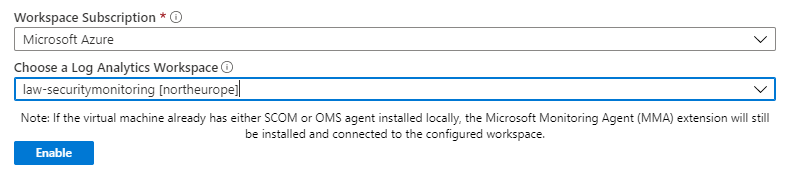
Once the Log Analytics workspace is deployed you can connect it your Virtual Machines and start collecting metric and Windows event log data. Just click on ‘Logs’ under the Monitoring section of your Virtual Machine and then assign it to your Log Analytics workspace. By clicking the ‘Enable’ button you will install the Log Analytics agent on your Virtual Machine.
Note: This agent was formerly known as the Microsoft Monitoring Agent.
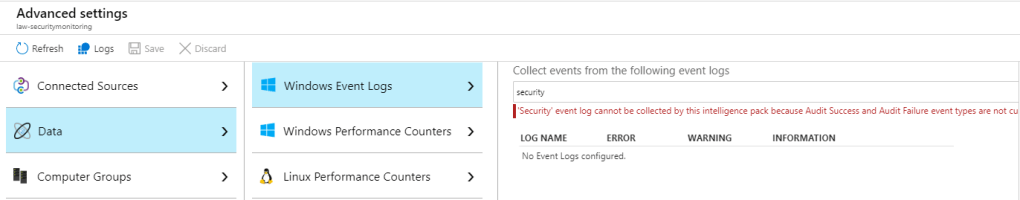
Once you are connected to the workspace then after a short period of time you can choose the performance counters and event logs that you would log to collect. If you click on the Log Analytics workspace resource and go to ‘Advanced settings’ and then click ‘Data’ and ‘Windows Event Logs’ you can select the event logs that you want to collect data from and query. However as I’ve mentioned already you may notice that the security event log is not one of the available options here. If you try to add the security event log by typing ‘security’ and clicking the add button you will receive a nice message to state that ‘audit success’ and ‘audit failure’ event types are not currently supported.
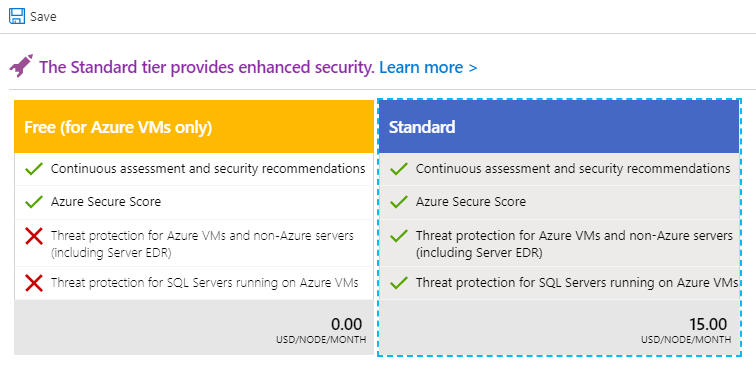
In order to query the security event log which is where our login failures are audited you will need to enable the standard tier of Security Center and unfortunately this will mean an additional cost.
Go to Security Center and select ‘Pricing & settings’. Click on the Log Analytics workspace you created earlier.
Select the ‘Standard’ pricing tier and check the plan is enabled for Virtual machines. Then click on the ‘Save’ button.
Now click on ‘Data collection’ and select ‘All Events’ to capture all of the Windows security events. Click ‘Save’ again.
At this point, I would suggest generating some test data. So attempt to connect to your Virtual Machine by RDP but enter an incorrect password. This will generate an event with ID 4625 in the security event log. It would be a good idea to confirm that these events are actually being created in the log, as otherwise you may have to enable audit logon failures in your local or group policy first.
Now, let’s query this via Log Analytics. Click on the Virtual Machine and click on ‘Logs’ under the ‘Monitoring’ section.
In the Query box just type: SecurityEvent and click ‘Run’. If you see some results then you have successfully connected the Virtual Machine to the Log Analytics workspace and are collecting security logs.

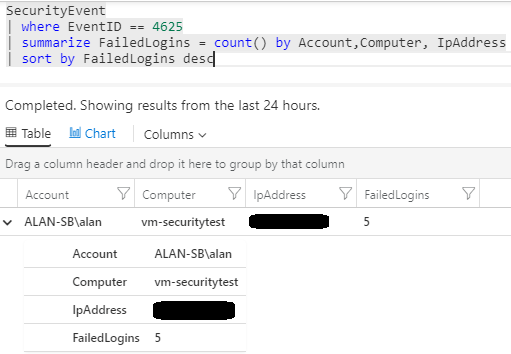
Now, let’s narrow our search to the failed login event ID of 4625. Use the KQL query below:
SecurityEvent
| where EventID == 4625
| summarize FailedLogins = count() by Account,Computer, IpAddress
| sort by FailedLogins desc
You should find your test data (the failed login attempt) in the query results.
If this looks OK then we can proceed to set up our alerts. There’s a few way the alerts can be triggered, we could use a Logic App or an Azure function for example but let’s just set up an Azure Monitor alert.
Let’s click on our Log Analytics workspace and click on ‘Alerts’ in the monitoring section. Click ‘New Alert Rule’. The resource should already be set to our Log Analytics workspace so click on the ‘Add’ button in the condition section.
Select the ‘Custom log search’ option. Enter the same KQL query from earlier in the ‘Search query’ box and set the alert logic to trigger if the number of results is greater than 0.
Then configure the query execution period and frequency for whatever you require. I’ve set mine to check the last 10 minute period every 5 minutes.
Here’s how it looks for me:

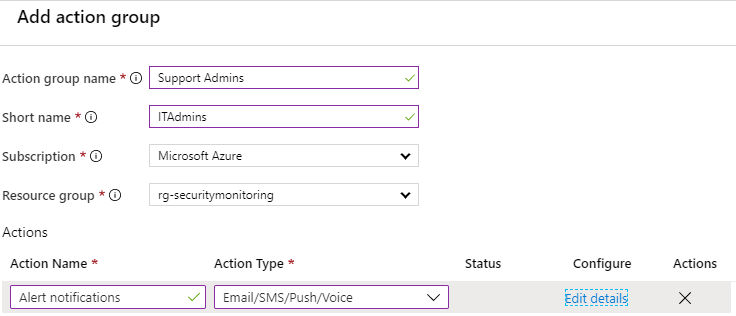
Click ‘Done’ and then select or create a new action group – this is the group of people who will receive the alert. You have a lot of options here but below I have created an action group to send an alert email to a support admins group.
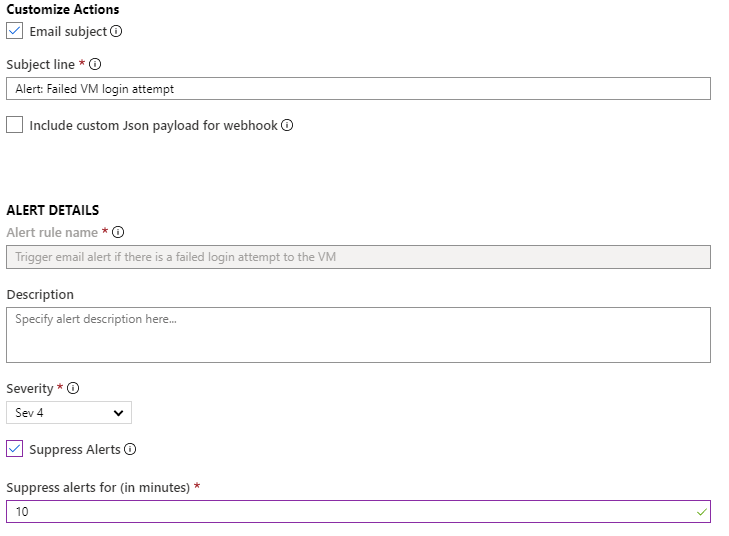
Finally, we need to give our alert rule a name and we can customize the email subject line here also. You may also want to suppress additional alerts for a set time period here.
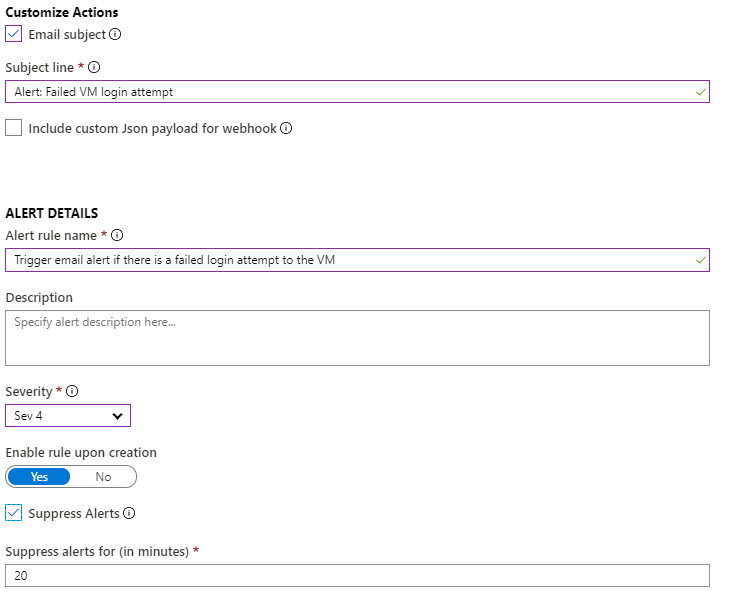
Make sure to to enable the rule upon creation and then click ‘Create alert rule’ when finished.
Now trigger some more test data and check that your alert trigger fires and that you receive notification by whatever method you specified.
During the time of writing this article I actually received a legitimate hack attempt which triggered my alert rule. Normally I would have RDP locked down but I just deployed a new Virtual Machine for the purposes of writing this article and hadn’t bothered to lock down RDP access. As you can see, it doesn’t take very long before your public IP addresses are probed so always remember to restrict access to your Virtual Machines!
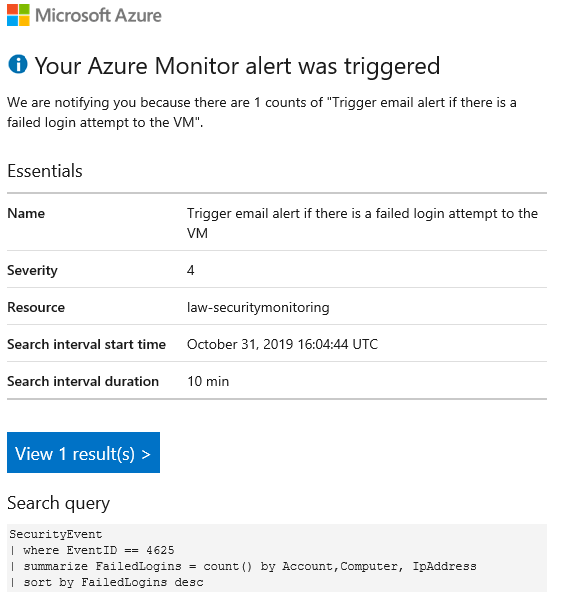
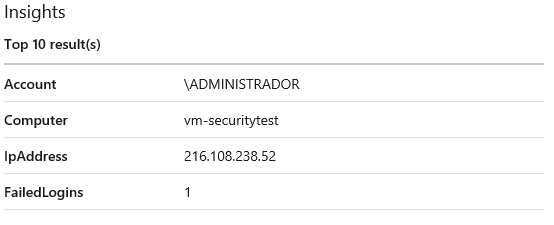
Here’s my email alert.
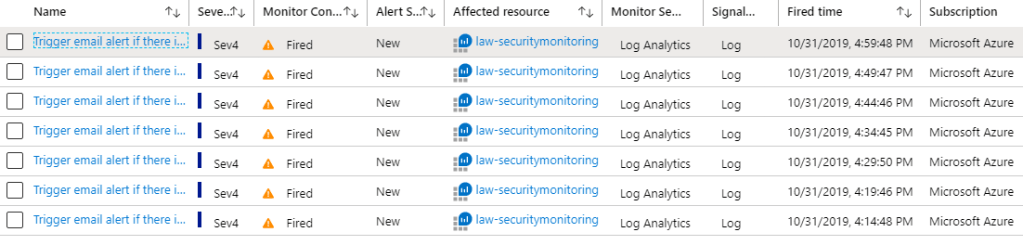
You can monitor your active alerts within Azure Monitor or via the alerts section of your Log Analytics workspace.
Finally, I know the title of this article mentions this is for monitoring Azure Virtual Machines but you can actually extend this to non-Azure Virtual Machines as well. Azure Monitor is a great way to centrally manage your hybrid cloud or multi-cloud environments rather than using different tool sets for each environment.

how to do the same if the vm is of linux one. Could you please help.
LikeLike