
Welcome to part 5 of my well-tempered Azure tenant series for MSPs. This time we will take a look at Azure Monitor. A powerful solution for collecting performance metrics and logs from your customer tenants. Using this telemetry we can provide proactive managed services through monitoring dashboards and alerts which is essential for any managed service provider.
Part 5: Azure Monitor
Azure Monitor has built-in support for Azure Lighthouse so although we have to configure the monitoring for each customer at the subscription level, we can monitor the collected telemetry centrally across our delegated customer tenants.
Azure Monitor is a collection of several services and insights tools that can be used to monitor many different types of resource in Azure. This blog post will focus on how as an MSP we can make use of some of these services to best manage our customers.
It’s all about the data
You may be aware that Log Analytics is a core service within Azure Monitor that can be used to query the data that we have captured and indeed we have already used this service in previous posts in this series. Here, we will once again make use of the single Log Analytics workspace per customer tenant that we deployed in an earlier post in this series.
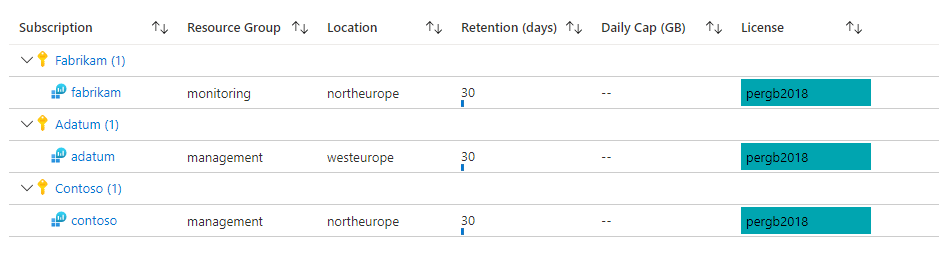
Using Azure Monitor you can get a centralised view of all of your Log Analytics deployments. You may have a requirement to set different retention periods or pricing tiers for different customers or even set a daily cap on data ingestion. This can all be reviewed across your customer tenants from a single viewpoint within Azure Monitor.
Insights
Microsoft have been rolling at a number of curated monitoring visualisation services over the past few years with the idea being to provide a good starting point for monitoring specific Azure services such as virtual machines, storage accounts, containers etc.
If we take a look at virtual machine insights as an example, we will see that this particular insights service requires an agent to be deployed to our virtual machines. This agent then sends telemetry to Log Analytics which we can visualise as graphs and charts in the insights service.
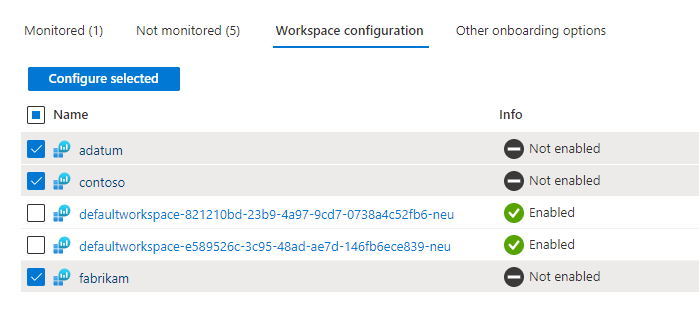
When setting this up we should first take a look at the Workspace configuration settings, this will show us if any upgrades are available for our existing Log Analytics workspaces. This is a worthwhile exercise as by upgrading the workspaces we will then have access to any new telemetry features that may now be available such as performance analysis. This is a very quick and simple upgrade process that can be done on multiple workspaces across your customer tenants all at once.
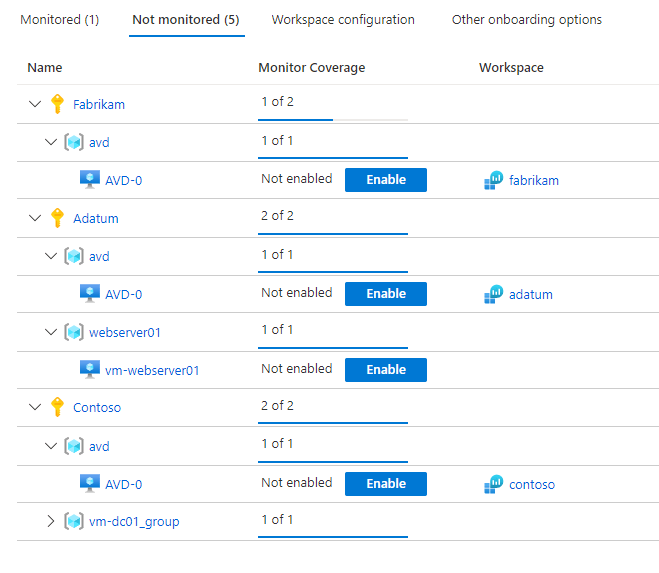
After this has completed, we can easily review the virtual machines that are not currently being monitoring by virtual machine insights. These can be enabled per VM from this central location.
Alerts
Alerts are your means of being proactive. You will likely want to receive an automated alert notification when something important happens. This could be an administrative activity such as somebody deleting a resource or stopping a virtual machine or a metric based alert such as CPU utilisation or disk performance exceeding a set threshold.
These alerts need to be scoped at the subscription level (or lower) so you will need to have separate alert rules per customer tenant even if these rules are effectively duplicates of one another.
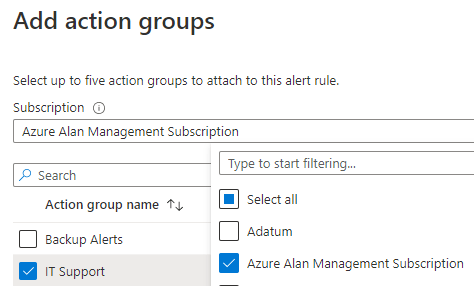
The good news is that you can create centralised action groups here. An action group is a set of notification preferences for your alerts, so logically these action groups should be created on your management tenant. These action groups can then be used as the alert rule notification settings for all of your customers. If you are using any alert actions to respond to these alerts in an automated fashion then these can also be deployed to your management tenant although this may depend on the exact requirements and permissions required by the automation process that you use.
When creating your alert rules, you will have to choose a resource group on the customer tenant to store the actual alert rule resources. These get created as a hidden resource and I recommend to use that central ‘management’ resource group that we have previously referenced and used for other customer management resources.

Any alerts that are generated can be reviewed, filtered and actioned centrally in the Azure portal for all delegated customer subscriptions. This is something that would be very useful to see in a pinned dashboard for an MSP and we will cover this next.

Use workbooks and dashboards for the win
Having all of this data is key, we need data in order to be able to provide proactive service management and to be able to properly troubleshoot issues when they occur. However, having vast amounts of data is not easy for humans to process. We need to use visual aids to be able to use this data quickly and efficiently.
Azure Monitor Workbooks have been one of the best additions to this service in recent years. Essentially they are a visualisation report of your Log Analytics data. They can be used to deliver a detailed report based on a number of KQL queries pulling data generated by multiple Azure resources. There are some great workbooks available right out of the box and of course you can also create your own custom workbooks to report on exactly what you need.
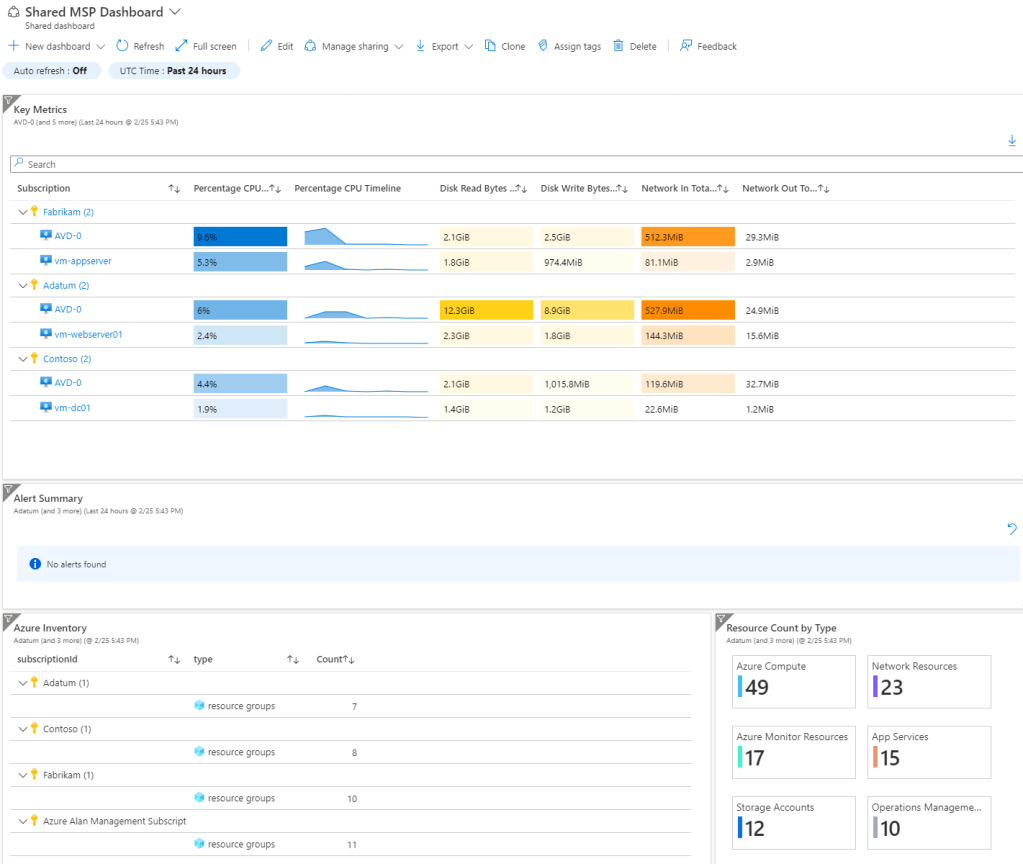
Better yet, you will find an ever increasing number of really useful workbooks are being created and shared by the tech community. I really like this inventory dashboard workbook from Billy York as an example. This can be deployed to your management tenant in no time at all to give you a great inventory report on all of the Azure resources deployed across all of your customers.

Workbooks are awesome but ideally you don’t want to go searching for them when you need to check on something urgently. I strongly recommend that you pin the ones that you need to use regularly to a shared dashboard. This dashboard can then be accessed by any of your staff to see vital information at a glance from one place and it is usually the first thing that you will see when you sign in to the Azure portal.
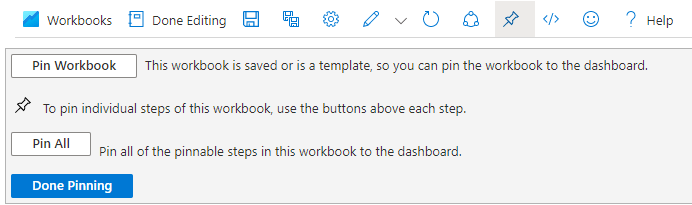
Pro tip: For pinning workbooks, don’t just click the pin icon on the workbook as this will just pin a shortcut link to the workbook. If you want the workbook report content to appear on your dashboard then set the filters of the workbook how you need them first, then click the edit button on the workbook, then click the show pin options icon highlighted below and click pin all.
This way you can very quickly create custom dashboards showing exactly what you need to see, combining different metrics and workbooks into a single or multiple dashboards.
Query at scale
Although not part of Azure Monitor, I thought this post was the most appropriate place to talk briefly about another really useful service – Azure Resource Graph. When we are working with Azure resources at scale as we will be when we are managing multiple customers it is often useful to query our managed resources across our entire customer base. By using a tool called Resource Graph Explorer, we have a “go to” option whenever we need to retrieve management data quickly across multiple resources and thankfully this service also supports Azure Lighthouse.
I’ve mentioned an example of a really useful inventory workbook already but Azure Resource Graph can also be a really useful tool for performing both simple and complex inventory queries as well as being a really important tool for governance reporting tasks.

What’s next?
Next time, we will be taking a step into hybrid management and looking at how we can manage our on-premises or multi-cloud resources as well as Azure resources using Azure Arc.

3 thoughts on “MSP: The well-tempered Azure tenant – Part 5”