
Welcome to my post for this year’s Azure Spring Clean. Thanks as always to Joe Carlyle and Thomas Thornton for organising this event. There’s a really interesting collection of contributions this year which I hope you will all enjoy.
For my contribution, I’ve decided to put together a getting started guide for Microsoft Sentinel (formerly known as Azure Sentinel). This can be quite a daunting service on first look but I thought I would cover off some of the basics of getting started that most organisations could use as a starting point.
This post will cover using some of the built-in solutions from Microsoft and focus on collecting logs from your other Microsoft cloud services, analysing those logs proactively and with a little automation thrown in for responding to security incidents.
Fundamentals
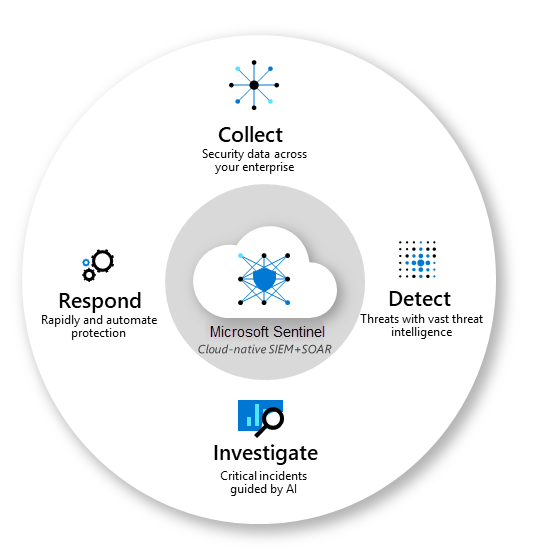
Let’s start with a quick intro to what Microsoft Sentinel actually is. Microsoft Sentinel is a cloud native service that provides the following solutions:
- Security information and event management (SIEM)
- Security orchestration, automation, and response (SOAR)
Microsoft Sentinel is therefore a single unified cloud-based solution that is used to proactively protect your organisation from security threats.
If you consider all of the potential threat and security vectors that a modern organisation has these days, it really becomes increasingly difficult for humans to be able to analyse all of this security data at scale. This is where the Sentinel service becomes such a huge asset, as through the scale and power of Azure compute and data services we can capture and analyse vast quantities of data in no time at all.
Furthermore, we can use AI and machine learning to look for unusual patterns and even respond to potential security threats automatically.
What’s particularly great about this solution is that there is no requirement for any underlying infrastructure. It’s entirely built on a scalable PaaS service and costs are charged based on the amount of data the service ingests and stores per gigabyte.
This means that you can get set up very quickly and as it’s cloud native you will also be able to deploy and maintain your Microsoft Sentinel solution via infrastructure as code through CI/CD DevOps pipelines.
As mentioned, the Sentinel service is all based on data. There are two costs to the service:
- Microsoft Sentinel data analysis per GB
- Log Analytics data storage per GB
There are some cost variances on the type of log data and various data archive and retrieval costs but fundamentally you are charged per GB of data and you receive 90 days of data retention included in the price for your log analytics data. This can be extended if required for an additional cost.
Important to note, you are not charged for the following log data:
- Azure Activity Logs
- Office 365 Audit Logs, including all SharePoint activity, Exchange admin activity, and Teams
- Security alerts, including alerts from Microsoft Defender for Cloud, Microsoft 365 Defender, Microsoft Defender for Office 365, Microsoft Defender for Identity, and Microsoft Defender for Endpoint
- Microsoft Defender for Cloud and Microsoft Defender for Cloud Apps alerts
At the time of writing there are some additional free log types for organisations who use the Microsoft 365 E5 license SKUs. Please refer to the pricing page for full details.
If your organisation is going to be ingesting a lot of log data like over 50GB per day then there are options to purchase commitment tiers for both Microsoft Sentinel and Log Analytics separately. These start at 100GB per day commitments but can offer a large saving over the default pay as you go (per GB) rate.
The Azure pricing calculator is the best way to work out what you need here once you know what your total daily log ingestion will be.
Getting Sentinel set up
The first resource we will need is our Log Analytics workspace, which is where our data will be stored for analysis. Depending on your requirements you may use just a single workspace or if you are a multi-geo organisation or a managed services provider managing multiple tenants then you may be better to have multiple workspaces and potentially hosted across difference Azure regions.
There is an excellent document on Microsoft Learn here including a decision tree diagram to help you make this decision.
For today, I will just deploy a single Log Analytics workspace in my home Azure region of North Europe.

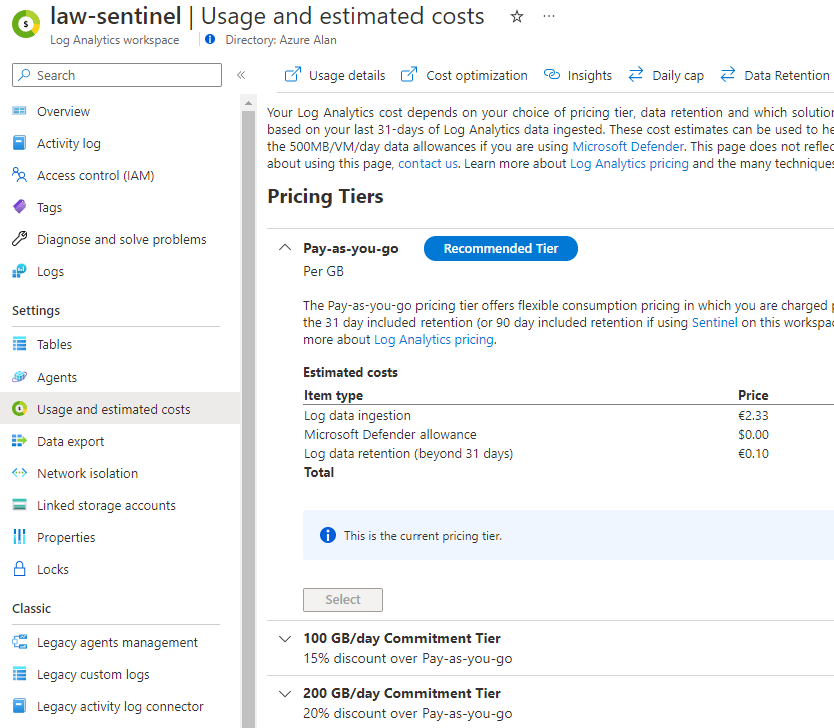
Once the workspace is deployed, I do always recommend to configure the usage settings right away to avoid any unexpected costs. This is where you can purchase those commitment tiers that I mentioned earlier.
You should change the data retention period here also. It will default to 30 days but remember, you get 90 days retention included for Microsoft Sentinel so assuming this workspace is only used for Microsoft Sentinel then set this retention period to at least 90 days or longer if you require it.
You can also det a daily cap limit on your data ingestion. This can be useful to avoid unexpected costs and as we will see later on the more services you connect and the more logs you enable this data can very quickly add up.
With the workspace all configured, we can now add the Microsoft Sentinel service to the workspace in the Azure portal which is no more than a few clicks of an operation.
I recommend to first review the Sentinel settings section. Here, you can purchase the commitment tier for the Sentinel service itself should you require it but for starting out leave this set to pay as you go. We will return to this settings screen later on.

Collect logs and analyse
Now that we have our services deployed – I told you it was quick! We need to start setting up the service.
The first thing that we need to do is to start collecting data from our various log sources. We are focussing on Microsoft cloud services here and you are probably aware that there are numerous Microsoft logs that we could ingest and analyse.
Sentinel accesses these logs by using data connectors, these are pre-built services used to connect to various data sources both Microsoft and many third party services. Once connected these logs are then ingested into the Log Analytics services for analysis.
The steps in this process here is changing in Q2 2023, so we will use the new method and deploy an out of the box solution directly from the Content hub section.
This is a really useful way to deploy everything you need for a monitoring solution:
Data connector – to connect to the data source and collect log data
Analytics rules – rule templates to analyse the log data and trigger alerts
Workbooks – visualisation reports and insights of the log data
Playbooks – used for automated response workflows and task orchestration
I would always start with the Azure Active Directory logs, these logs are used by all Microsoft cloud services and any authentication to any of these services will generate log data. This is a really good place to start as it’s a great source of security data for your Microsoft tenant.
Let’s deploy the Azure Active Directory solution from the content hub.

This is almost a single click deployment, just create the solution and make sure to deploy to your existing Microsoft Sentinel workspace. This will deploy and configure the data connector and create a number of rule templates that can be used later on.

Once the solution is deployed, you can go back into the solution again via content hub and then open the connector page. Here, you can specify which Azure Active Directory logs you want to ingest and analyse.
You will have similar choices for all of your data connectors so don’t just tick every box unless you know you need to analyse all data. Remember, you get charged per GB for log ingestion and these log files will add up.
For Azure Active Directory, as it’s such a core service you may want to include everything but at a minimum I would suggest the Sign-in logs and the Audit logs are of most importance.
Note: An Azure AD Premium P1/P2 license is required on your tenant to export Sign-In logs

Don’t forget to apply the changes above and then if you click on Next Steps you will see a long list of pre-built analytic rule templates specifically for Azure Active Directory. If you want to actually use these rules in your own environment then you will need to create a rule from the template, these rules are not in use otherwise. You can create these rules here one by one via the create rule button or else you might want to script this if you will be using a lot of them.
For this solution, you will see there are over 100 rule templates and there is a good chance that you don’t want all of these. In fact, you may only want to use a few of these as otherwise you will likely end up with a lot of incidents being created due to false positives or benign user actions.
I would start with the high severity rules and work your way down the list for the ones that you want to use but if you are starting out then I would start with just a few rules until you get more familiar with Microsoft Sentinel and how it works first.

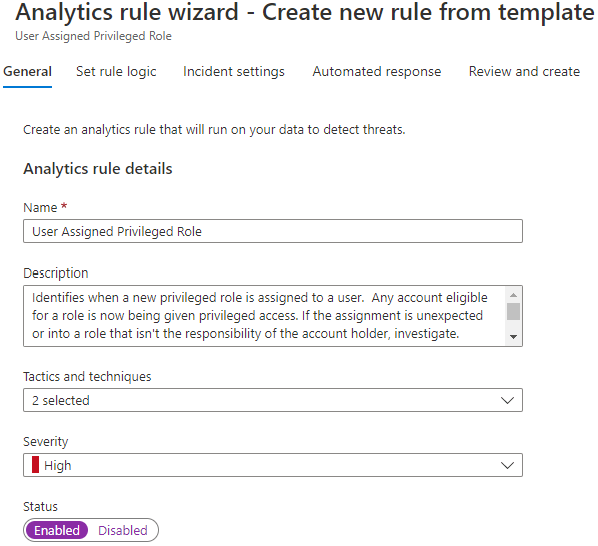
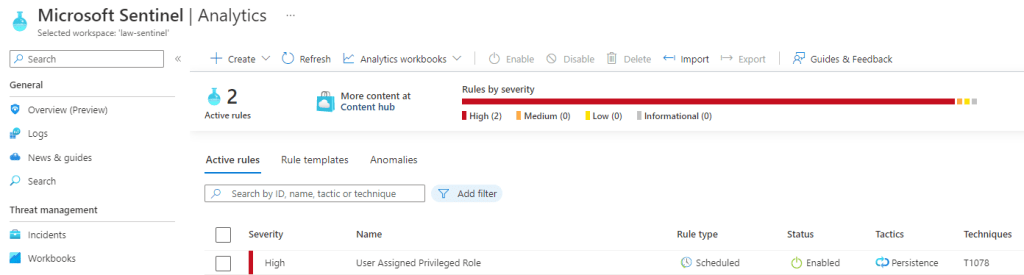
Let’s run through an example here and Create a rule from the template for ‘User Assigned Privileged Role‘. This rule creates an incident whenever a user in the organisation is granted an ‘Admin’ role. I’ve picked this one as an example as it’s relatively easy to demonstrate.
The first tab in the create rule wizard is the General section, where you can name the rule and give it a severity rating, you can also enable the rule from here or opt to do this later.
Under Set rule logic, you will find the KQL code pre-defined for this rule. This is the query that runs against the log data in Log Analytics and you can customise this code as you wish. You can even test the code from this screen to ensure it works OK and review the results of any existing data that matches the query.
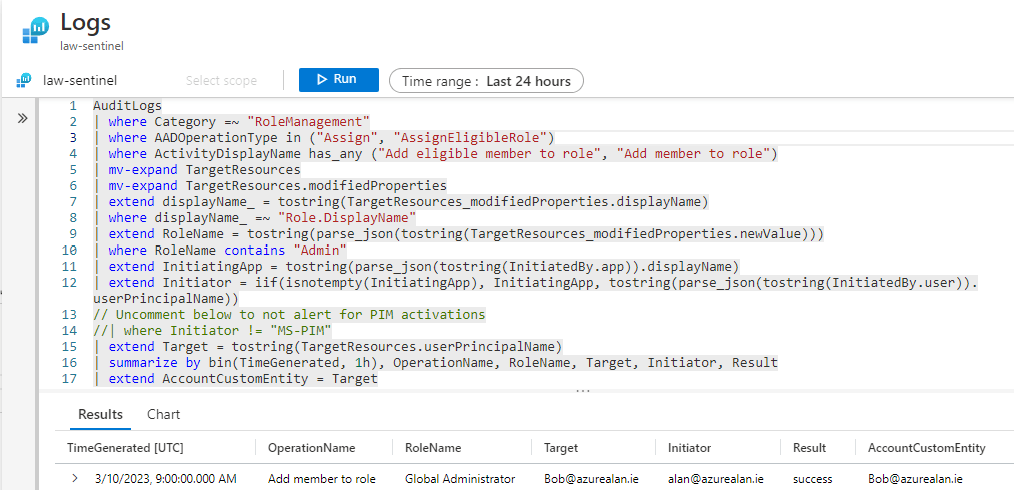
There are some other options on this page for alerting and how often this query fires and how far back in time it will check. This particular rule by default checks every 2 hours and looks back over the last 2 hours. You can change this to anything from every 5 minutes to every 14 days.
Under Incident Settings, you define if you want any results from the query to generate an incident in Sentinel and how those alerts are grouped together. We will use the default setting and enable the creating of incidents here.
In Automated Response, you can configure any automation rules that you want this rule to trigger. We’ll come back to this later.
Let’s create that first rule now. You should see this listed as an active rule under Analytics now and from here it can be managed and disabled if required.
Testing
Let’s do a quick test on this rule and make sure that it’s working. I will go and assign one of my users ‘Bob’ with a global administrator role.
If you recall, the analytics rule that I added will check the logs every 2 hours so potentially I might have to wait this long here unless you modify that rule to check more frequently.
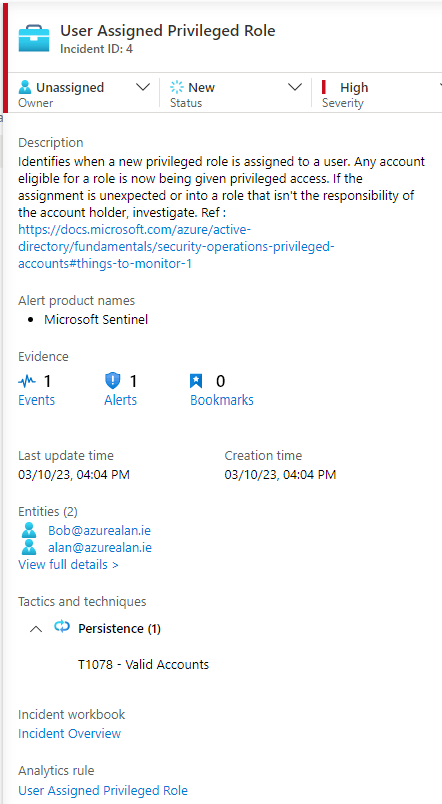
We wait a while and then sure enough, an incident is created as we have a match with our analytics rule.
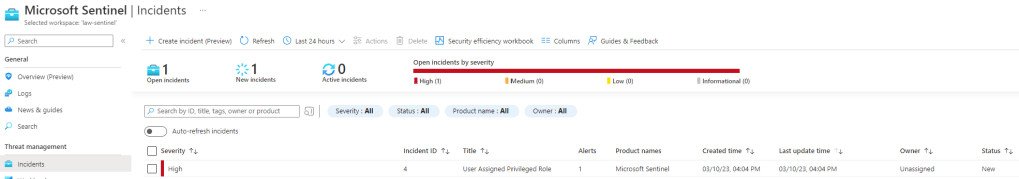
At this point, you have many options. You can investigate the incident yourself and click on the incident to review more detailed log analysis and insights. You could manually trigger a playbook to run an automated routine or else you could assign this incident as a task to a security engineer to follow up.
Congratulations you now have a Security Operations Center (SOC)!
Reports
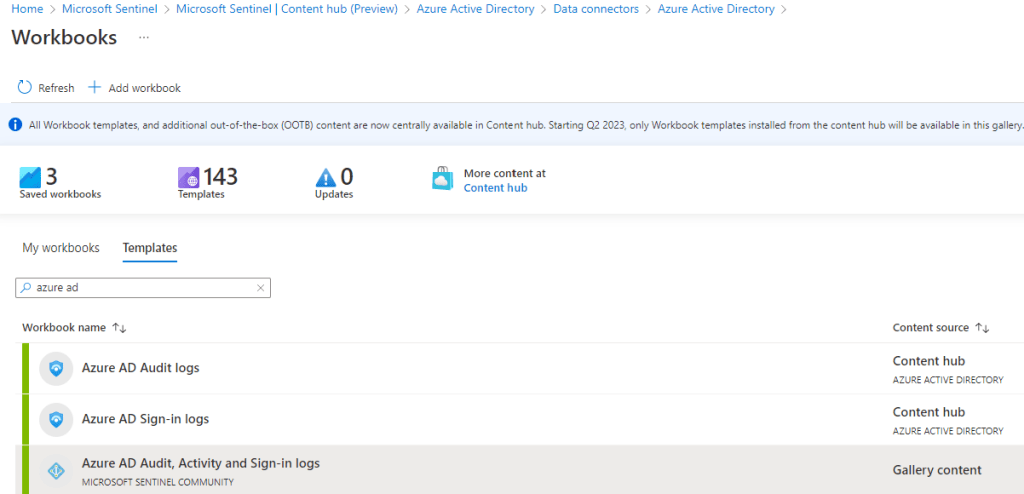
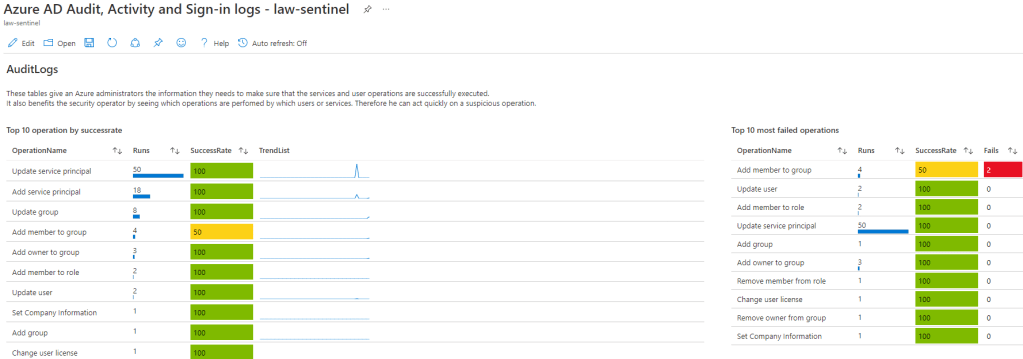
When it comes to reporting this is where you will need to be able to quickly visualise all that log data. In the Azure portal, we use workbooks for this purpose and thankfully there are a number of workbook templates available from Microsoft and the larger community. You can of course build your own but you will likely find the existing workbooks will be very helpful and can be customised to meet your exact requirements.
Once again, we access these workbooks via the content hub and then just search for the service that you are monitoring. If you search for Azure AD, you will find a few workbooks ready to go here. You can select these templates and then save them to your own environment.
Once the templates are installed you will have access to these workbooks and as long as you have relevant data ingested you should see the results immediately in your saved workbooks.
Automation
This is the SOAR element of Sentinel and all about how we can automate a response for when an incident is created. Automated responses or playbooks are performed by Logic Apps so we will need to create a Logic App to perform a task. In the real world, this might disable an account that has potentially been compromised but for today I am going to create a generic automation rule for all incidents that get created.
Just to note here, that you will find some playbook templates are available from the solution we deployed already however, I thought I would demonstrate how easy it is to create your own.
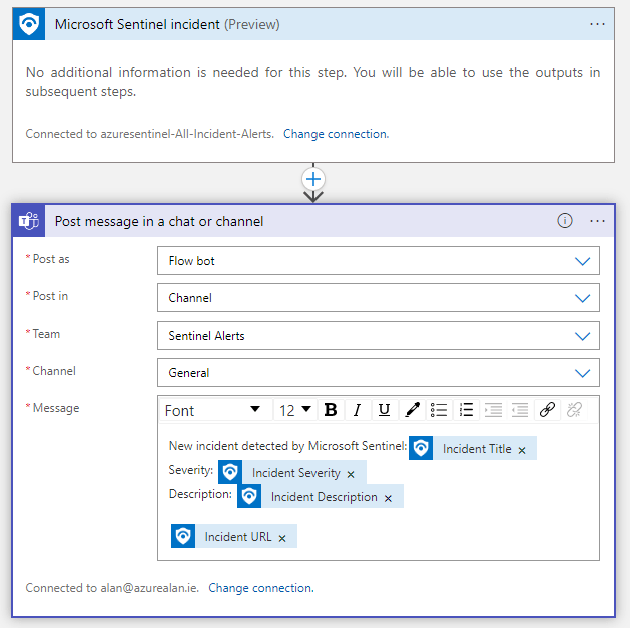
I will create a new logic app to generate an alert to a Microsoft Teams channel that I use so that I get notified if any new incidents are created by Microsoft Sentinel.
Even without using an existing template, there is now a really quick way to create your own playbook via the Automation section of Sentinel. If you choose to create a Playbook with incident trigger from the below menu this will create the logic app with the correct trigger in place. This process also creates the system-assigned managed identity for the logic app connection.

Below is an example of how I used my logic app to post a message to Microsoft Teams with my Sentinel incident details.
Back in Sentinel, under automation I will now create a new automation rule to tie this all together.
This rule will do three things:
- Change the incident status to ‘Active’
- Assign the incident to me
- Trigger the playbook to post the notification to Microsoft Teams

Note: You will have to grant permissions for Sentinel to be able to trigger the playbook. Just click the link shown below if you see this message.

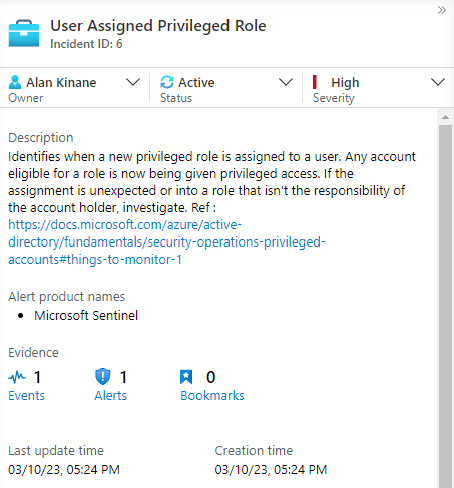
Now if we trigger a new incident we will see the automation rule kicks in.
We can see below that the status has been changed to ‘Active’ and that I have been assigned as the incident owner.
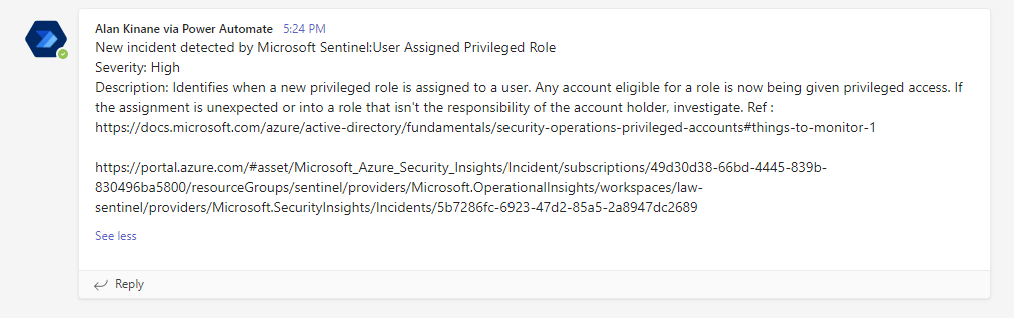
If I open up Microsoft Teams, I can see that the logic app has also run successfully and a new message has been posted in the Teams channel.
What next?
As mentioned there are literally hundreds of pre-built Microsoft Sentinel solutions available for deployment nowadays. The process of setting these up is the same as what I have covered in this post. I do recommend to make use of the various Microsoft solutions if your organisation is using these services.
Remember, many of these will have free log ingestion costs especially if you are using Microsoft 365 E5 licenses.

Just don’t go enabling all of the provided rule templates unless you are prepared to handle a lot of incidents being created. If a lot of benign incidents are being created then your organisation may have very lax security policies that need to be stregthened.
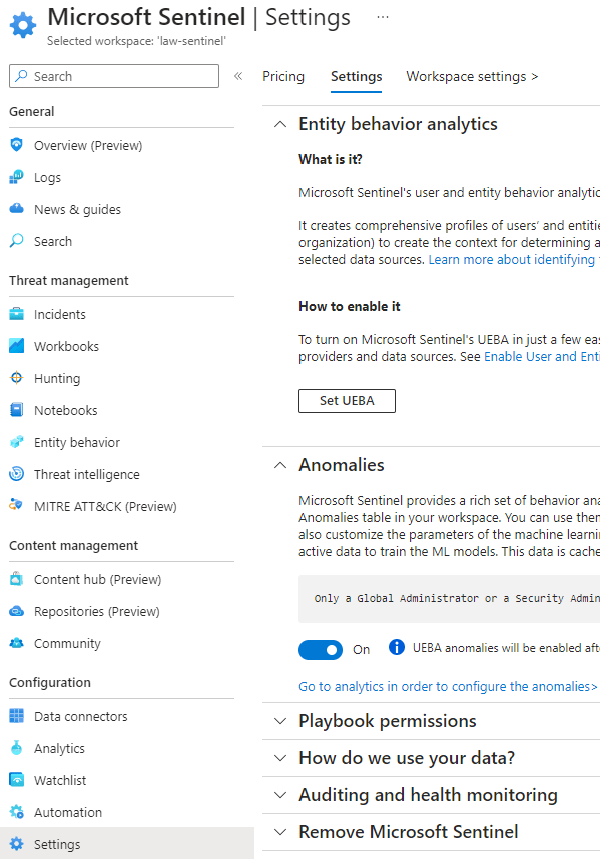
Another setting that we did not cover and also recommended, is to enable User and Entity Behaviour Analytics (UEFA). You will find this in the Sentinel settings section. Enabling this feature will give Sentinel permissions to use machine learning to analyse the logs that the service collects and to build a behaviour baseline profile. This will help Sentinel to identify and alert you if any unusual activity occurs in your environment.
Conclusion
This post is very much a getting started guide but given the out of the box content now available you can see just how quick it is to get started and to start collecting your data.
The important point here is that this service needs to be manageable. There is no point in collecting gigabytes of data without analysing it and equally there’s no point in being flooded with so many alerts that you can’t triage the sheer volume that Sentinel generates.
This is also not a “set and forget” service. Security recommendations are constantly changing and it’s important to keep your security solutions up to date. If you are using the out of the box content solutions, you will get prompted to install new solution updates from time to time and there is a constant need for fine tuning your threat detection rules and responses.
Security is always a layered approach and I believe Microsoft Sentinel adds a very powerful toolkit that would benefit any organisation but having the security skills to understand what it is actually doing and how to manage it is a different matter.
For those of you who may not have the resources to manage this service in house, it’s worth noting that there are security partners out there who offer an outsourced 24/7 SOC service based on Microsoft Sentinel.
When it comes to security there’s a lot to be said for having expertise at your disposal.

Hi Alan, thanks for your post.
I followed your steps however they call it Entra ID instead of Active Directory recently.
I noticed that the “RoleManagement” logs do not get forwarded to log analytics, where other Audit Logs such as device, users, group changes do.
We do not have an Entra ID Premium P1/P2 license but I think that only affects the sign-in logs not the “RoleManagement” log?
Do you have any idea about this?
Thanks again.
Hunter
LikeLike